Boston’s Child-Care Supply Crisis
The authors would like to thank members of the Birth to Eight Data Committee of the Boston Opportunity Agenda for informing and revising this work. This brief would not have been possible without the support and partnership of the City of Boston, the Mayor’s Office for Women’s Advancement, the Mayor’s Office Economic Mobility Lab, the United Way of Massachusetts Bay and Merrimack Valley, Strategies for Children, the Boston Foundation, Wellesley Centers for Women, Boston Children’s Hospital, Massachusetts Department of Public Health, Massachusetts Department of Early Education and Care, Boston Indicators Project, and the Boston Planning and Development Agency.
We especially want to thank the active members of the Birth to Eight Collaborative’s Data Committee who gave substantial feedback that helped us delineate the final version of this brief: Karley Ausiello (United Way of Massachusetts Bay and Merrimack Valley); Jocelyn Bowne (Massachusetts Department of Early Education and Care); Anne Calef (Boston Indicators); Ayesha Cammaerts (Boston Children’s Hospital); Peter Ciurczak (Boston Indicators); Turahn Dorsey (Eastern Bank); Titus DosRemedios (Strategies for Children); Audrey Gallo (EDC); Christina Kim (Boston Planning & Development Agency); Kimberly Lucas (MetroLab Network); Wendy Robeson (Wellesley Centers for Women); Anne Taylor (Boston Public Schools); Carla Therriault (United Way of Massachusetts Bay and Merrimack Valley); Alexandra Valdez (Mayor’s Office for Women’s Advancement ); and Wayne Ysaguirre (Care Institute).
About the Boston Opportunity Agenda
The Boston Opportunity Agenda is a public/private partnership that works urgently and strategically to transform the Boston education landscape from cradle to career. Our focus is on removing the systemic barriers that create unacceptable outcomes and lack of opportunity for historically oppressed and economically disadvantaged populations and creating a just, equitable education system.
About the Boston Birth to Eight Collaborative
Convened by the Boston Opportunity Agenda and the United Way of Massachusetts Bay and Merrimack Valley, the Birth to Eight Collaborative includes parents and more than 200 representatives from early education centers, family child-care, nonprofit organizations, schools, public health, philanthropy and medical institutions. Together we are working to ensure all children are ready for sustained success in kindergarten and beyond.
Summary of Findings
Boston’s state of child care was in a crisis long before COVID-19. The pandemic further disrupted this fragile system and had an impact on the spaces where young children receive developmental screenings and intervention services. Using the best data available, this research brief contextualizes the pandemic impact across Boston neighborhoods on:
1) licensed child-care supply for children ages 0 to 5 years in center-based and family child-care (FCC) programs; and
2) utilization of Ages & Stages Questionnaire (ASQ) developmental screenings, and referral to and utilization of Early Intervention services.
Our analysis using 2021, 2020 and 2017 data found the following:
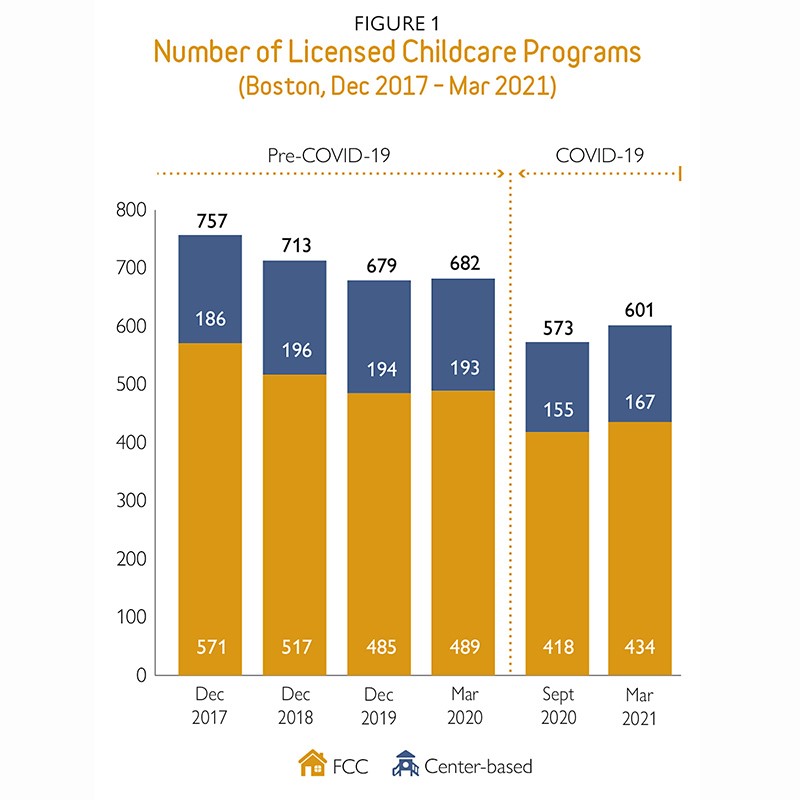
- From December 2017 to March 2021, we have seen a 21 percent decrease in the number of center-based and FCC providers at the city level. During the same period, the number of seats available for children 0–5 years fell by 11.3 percent.
- As of March 2021, Boston permanently had lost 13 percent (68 FCCs and nine centers) of its licensed child-care programs that were open pre-pandemic.
- Child-care programs with subsidized slots were 4.6 times more likely to reopen in March 2021.
- 2017 to 2021 losses in child-care seats vary widely by neighborhoods: The range between the greatest and the smallest losses is almost 30 percent.
- A 15 percent decrease in the total number of screens using the ASQ, a developmental screening tool used by family support organizations and center-based child care, occurred when comparing March 2019–March 2020 to March 2020–March 2021.
- Boston experienced a 40 percent decrease in the number of eligible children receiving early intervention services between February 2020 and February 2021. Most neighborhood saw declines in the number of eligible children referred to Early Intervention.
- Not only were fewer children receiving Early Intervention services, but the children who did receive services got fewer hours of it. The average number of hours per month of intervention services dropped from 22 to five.
Authors
Fernanda Q. Campbell, Ph.D.
Boston Opportunity Agenda
Pratima A. Patil, Ed.M.
Boston Opportunity Agenda
Kristin McSwain
Boston Opportunity Agenda
Ashley White
Economic Mobility Lab – City of Boston
Editor
Sandy Kendall
The Boston Foundation
Design
Kate Canfield
Canfield Design
Editor's Note: In addition to the recommendations included in this brief, the Boston Birth to Eight Collaborative has published a set of recommendations for the next Mayor of Boston, including steps that the City can take in partnership with stakeholders and families to address the creation and support of additional center-based and FCC programs.
The recommendations also include opportunities to expand developmental screenings for infants and toddlers as a part of the City’s COVID recovery plan.
Introduction
Boston’s child-care crisis was a gloomy reality long before COVID-19 entered our lives in 2020. As of 2017, 35 percent of 0- to 5-year-olds did not have access to early education and care seats in their neighborhoods, if desired by their families. Our 2019 report detailed the wide variability in access trending by children’s age groups and neighborhoods.1 Concerned about the pandemic’s impact on an already unstable early education and care sector, we tracked shifts in supply of child care during COVID. Our fall 2020 brief, Boston's Childcare Supply Crisis: What a Pandemic Reveals, focused on these changes, as well as the sector’s initial response to the crisis.2 Between March and September 2020, the supply of Boston’s child care fell by an average of 16 percent, with some neighborhoods bearing these losses more than others. By September 2020, East Boston and Brighton had the highest total losses of seats, approximately 30 percent, while Back Bay/Beacon Hill lost a little over 1 percent of its seats. This 2021 brief tracks worrying losses in the supply of child care and includes a special focus on the impact of the pandemic on families accessing screening and services for children who may need early intervention. Additionally, this brief highlights potential levers for building resilience in the early education and care sector.
This past pandemic year has been a struggle for so many, leaving no one unscathed. State and local officials, as well as individual households, have been learning about the risks of COVID-19, while making professional and personal decisions to ensure safety while somehow continuing to move forward. Our effort here is to focus on the data to help us reflect on how previous policy and funding decisions have unevenly served Boston’s early education and care providers and working parents with young children.
In early 2020, state officials worked to simultaneously institute closures to reduce the risk of COVID-19 spread and support essential services to remain open with enhanced health precautions. Under these circumstances, initially all Massachusetts child-care providers were mandated to shut down in March 2020 until further notice. The only exception were providers serving in the Exempt Emergency Child-Care Program, which was launched by the Massachusetts Department of Early Education and Care (EEC) to serve children of essential workers.3 Preparation for reopening childcare programs started in early June 2020 with the release of EEC’s “Massachusetts Child and Youth Serving Programs Reopen Approach: Minimum Requirements for Health and Safety.”4 The earliest intent-to-reopen date submitted by a Boston program was June 22, 2020. However, the majority planned to reopen on or after June 29, 2020.5
A stark finding of our 2020 brief: Programs that accepted subsidies pre-pandemic were more likely to have an intent to reopen by September 14, 2020. The higher the number of children on subsidies in a given program, the higher its likelihood of reopening.6 EEC continued to pay providers for the subsidy slots they had before the shutdown during the months when programs were closed. After programs reopened, they were paid for subsidized children enrolled regardless of attendance, a decision that amplified the fragility of the traditional financing system (payment by child enrolled and attending). Conversely, providers relying solely on parent fees pre-pandemic, traditionally a higher rate of return, suddenly had no income source, which may explain some of the difference in child-care recovery by neighborhood. The current system does not adequately serve child-care providers: Those who serve the most economically vulnerable families are chronically underpaid, and those who don’t are left without a safety net during economic shocks.
This is the second of two briefs published following our first 2019 annual landscape of early childhood education and care programs in Boston. In the current brief, we update the data for ongoing monitoring of the COVID pandemic’s impact on Boston’s child-care sector and begin monitoring developmental screenings and early intervention services. Data in this brief cover licensed child-care programs offering full-time, standard hours for education and care and Early Intervention (EI) data from the Boston Public Health Commission. We explore this data in our effort to answer: How have the trends in child-care supply evolved between September 2020 and March 2021? What happened to the number of children referred to EI services during this period in comparison to pre-pandemic months? As we have done in the prior two publications about early education and care, we present the data at the city level and by 15 ZIP Code–defined neighborhoods of Boston.
Main Findings
COVID Impact (March 2020-March 2021)
In March 2020, before the pandemic shutdown, 6837 programs (489 FCC and 194 centers) were licensed to care for children 0–5 years of age in Boston, full-time during standard business hours. By September 2020, that number had fallen to 573. Since the November publication of the 2020 brief, more Boston programs have submitted an intent to reopen plan to EEC, with the majority of these providers re-opening between June and August of 2020. As of March 2021, the current number of programs with an intent to reopen is 588. This represents 86 percent of the programs that were open in March 2020. The strongest predictor of a program operating in March 2020 to reopen in March 2021 was acceptance of subsidies. Programs with subsidized slots were 4.6 times more likely to reopen by March 2021 (OR = 4.57, 95% CI: 2.86 7.29, p>.000). An additional 13 programs opened after June 2020 bringing the percentage of licensed programs to 88 percent in March 2021.
FIGURE 1 shows the number of programs (FCC and center-based) in the city between December 2017 and March 2021 and FIGURE 2 shows the number of seats in these programs. For this brief we analyze the time from child-care shut down through the first eight months of recovery, March 2020 – 2021. While the initial percentage of programs with the intent to reopen contained a higher share of FCC programs, by March of 2021 we see an equal percentage of center based and FCC programs returning to operation. The percentages change slightly with the addition of 13 new FCC providers bringing the percentage of FCCs and centers to 89 and 86, respectively. Every additional center and FCC that reopens provides additional seats to meet the needs of children and families. However, given the chronic shortage of child care in Boston, an increase of four percentage points in six months does little to close the demand-access gap that has been exacerbated by the pandemic. Additionally, the vast majority of programs licensed in March 2020 have already reopened. Of the 489 FCCs open in March 2020, 68 have closed permanently and 20 have not submitted an intent to reopen. For centers, of the original 194, nine have closed permanently and 18 have no intent to reopen date. Relying on centers and FCC that were in operation in March 2020 to reopen will not close the gap widened by COVID, since the data indicate that those who intended to reopen have done so. Prior to the onset of COVID-19, there were not enough providers or slots to cover the number of young children in the city. COVID-19 further reduced the supply, while the demand remained constant. As we return, more families will find it difficult to find care—this time, not just because it’s expensive, but also because their former care provider is no longer there.
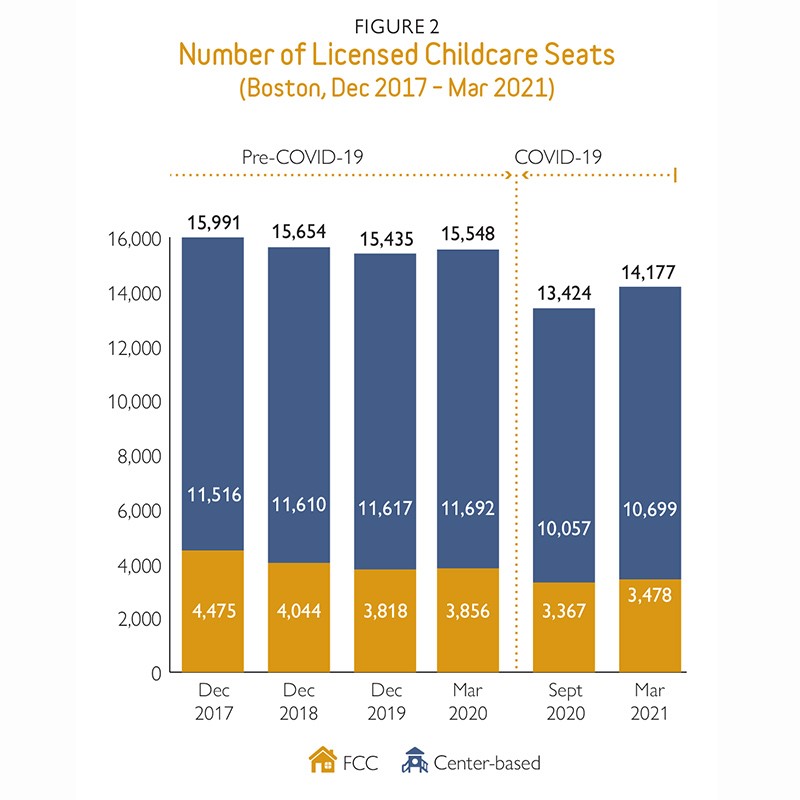
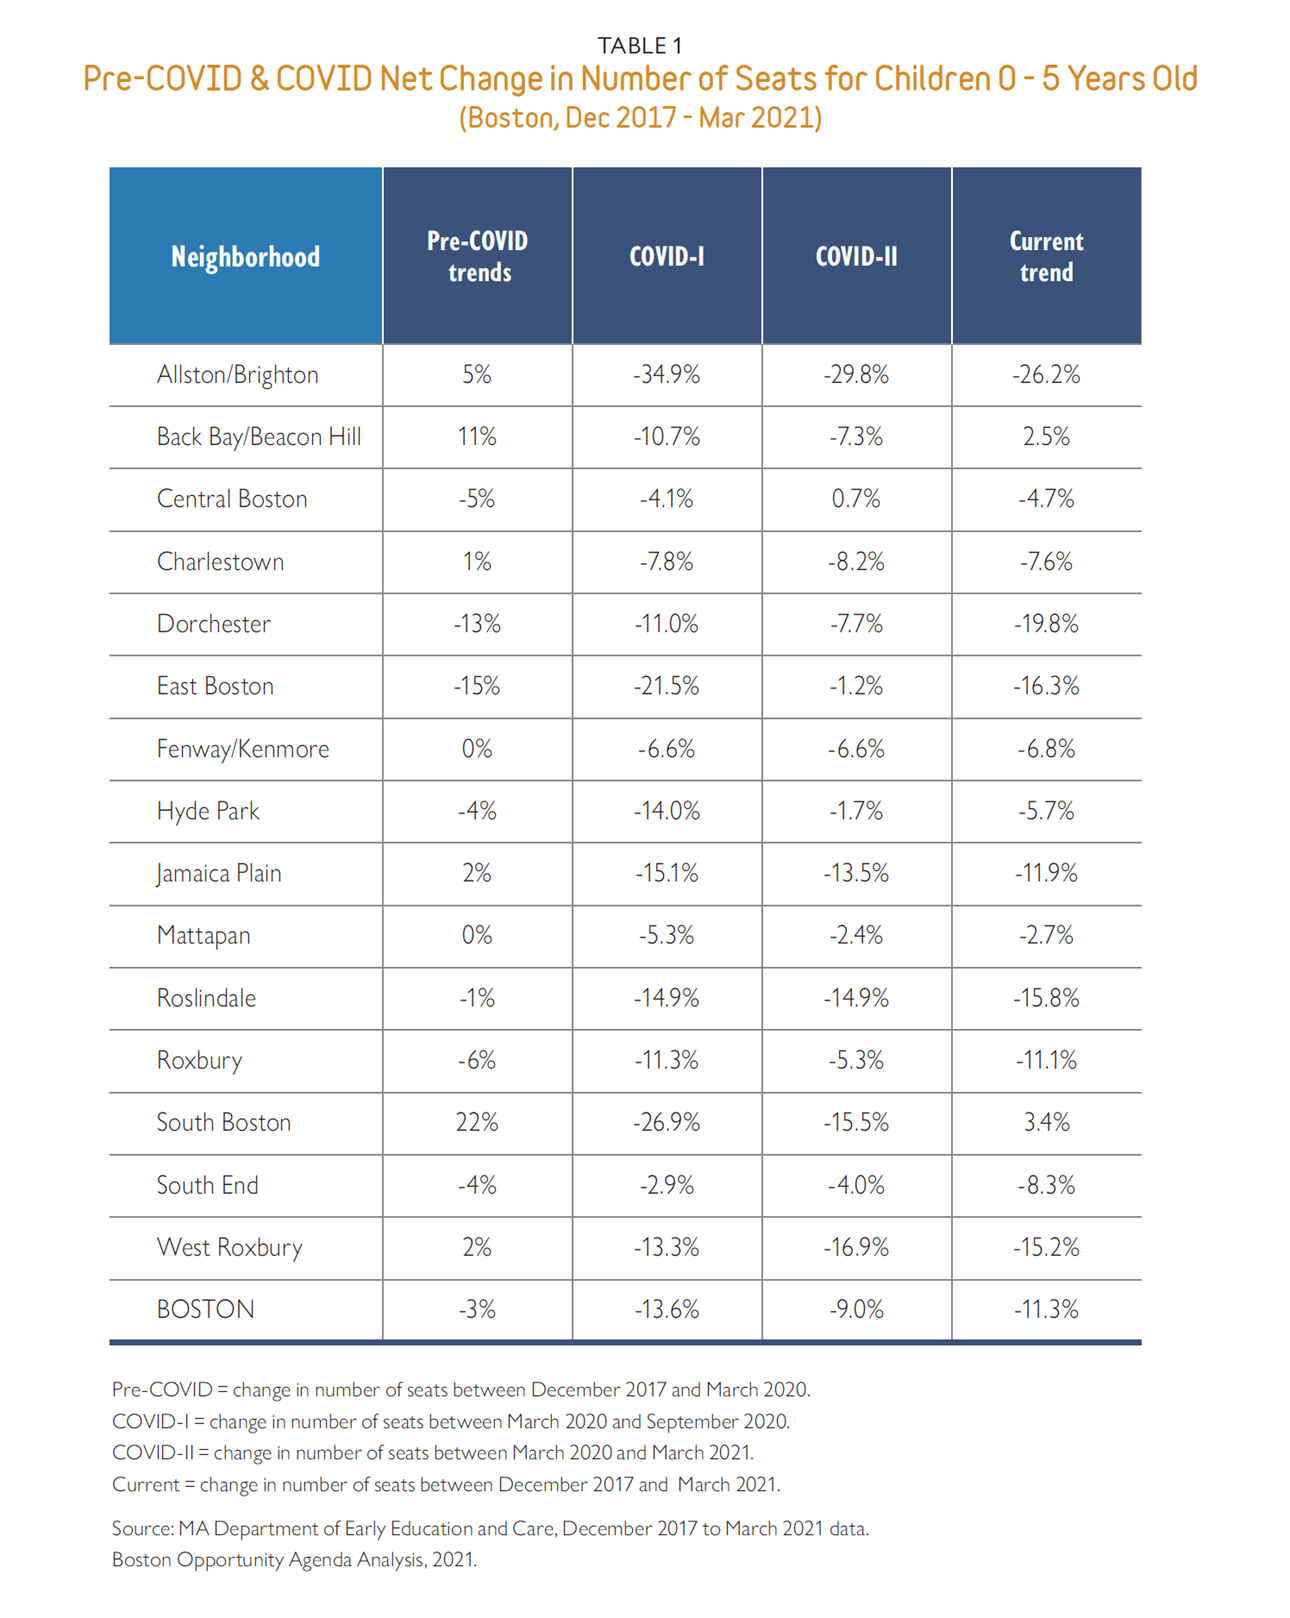
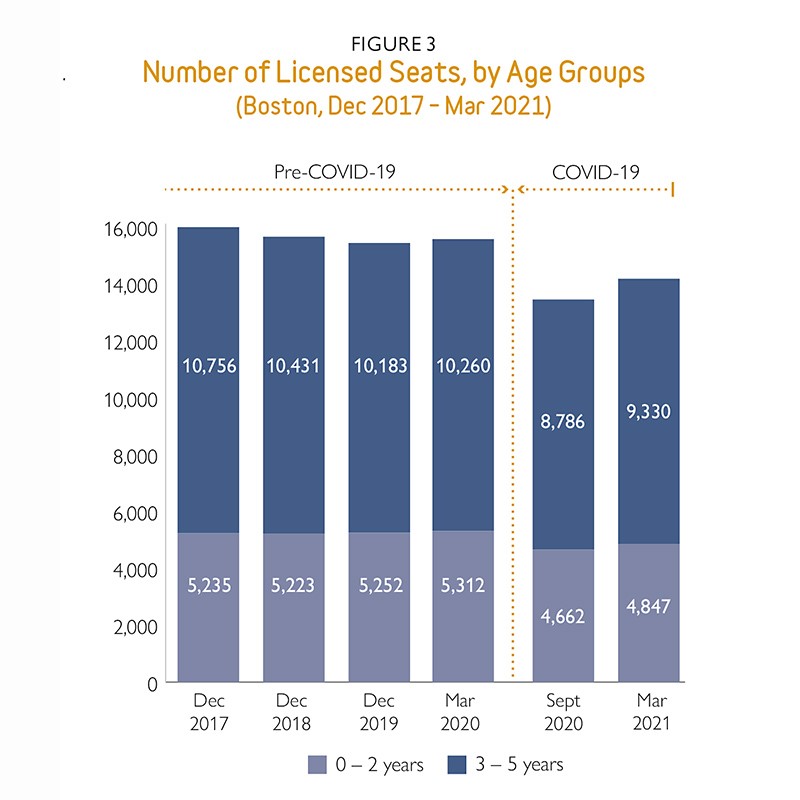
A deeper dive into the number of seats by age group, as shown in FIGURE 3, depicts a modest increase of seats for children 0–2 years (185) and a larger, but still modest increase in seats for children 3–5 years (544) between September 2020 and March 2021 as programs have re-opened. However, the overall trend from March 2020 to March 2021 is a drop of 9 percent with the longer trend from our baseline in December 2017 being -11.3 percent (see Appendix, TABLE 1). An important caveat on these numbers: They represent licensed capacity and not necessarily the number of seats that are actually available. Since reopening, center-based programs have faced tremendous staffing challenges. Many center-based directors report that they are not able to open all the classrooms for which they are licensed. This challenge varies across centers, with reports of some centers having only one classroom closed while others have as many as eight or nine closed per center. The data on staffing shortages is not yet comprehensive and the long-term implications are not fully understood. The Boston Opportunity Agenda is working with stakeholders to collect workforce information by neighborhood for the city of Boston this summer. The early childhood workforce and its challenges will be the subject of our next State of Early Education and Care Report to be released in November 2021.
Program Type by Neighborhood
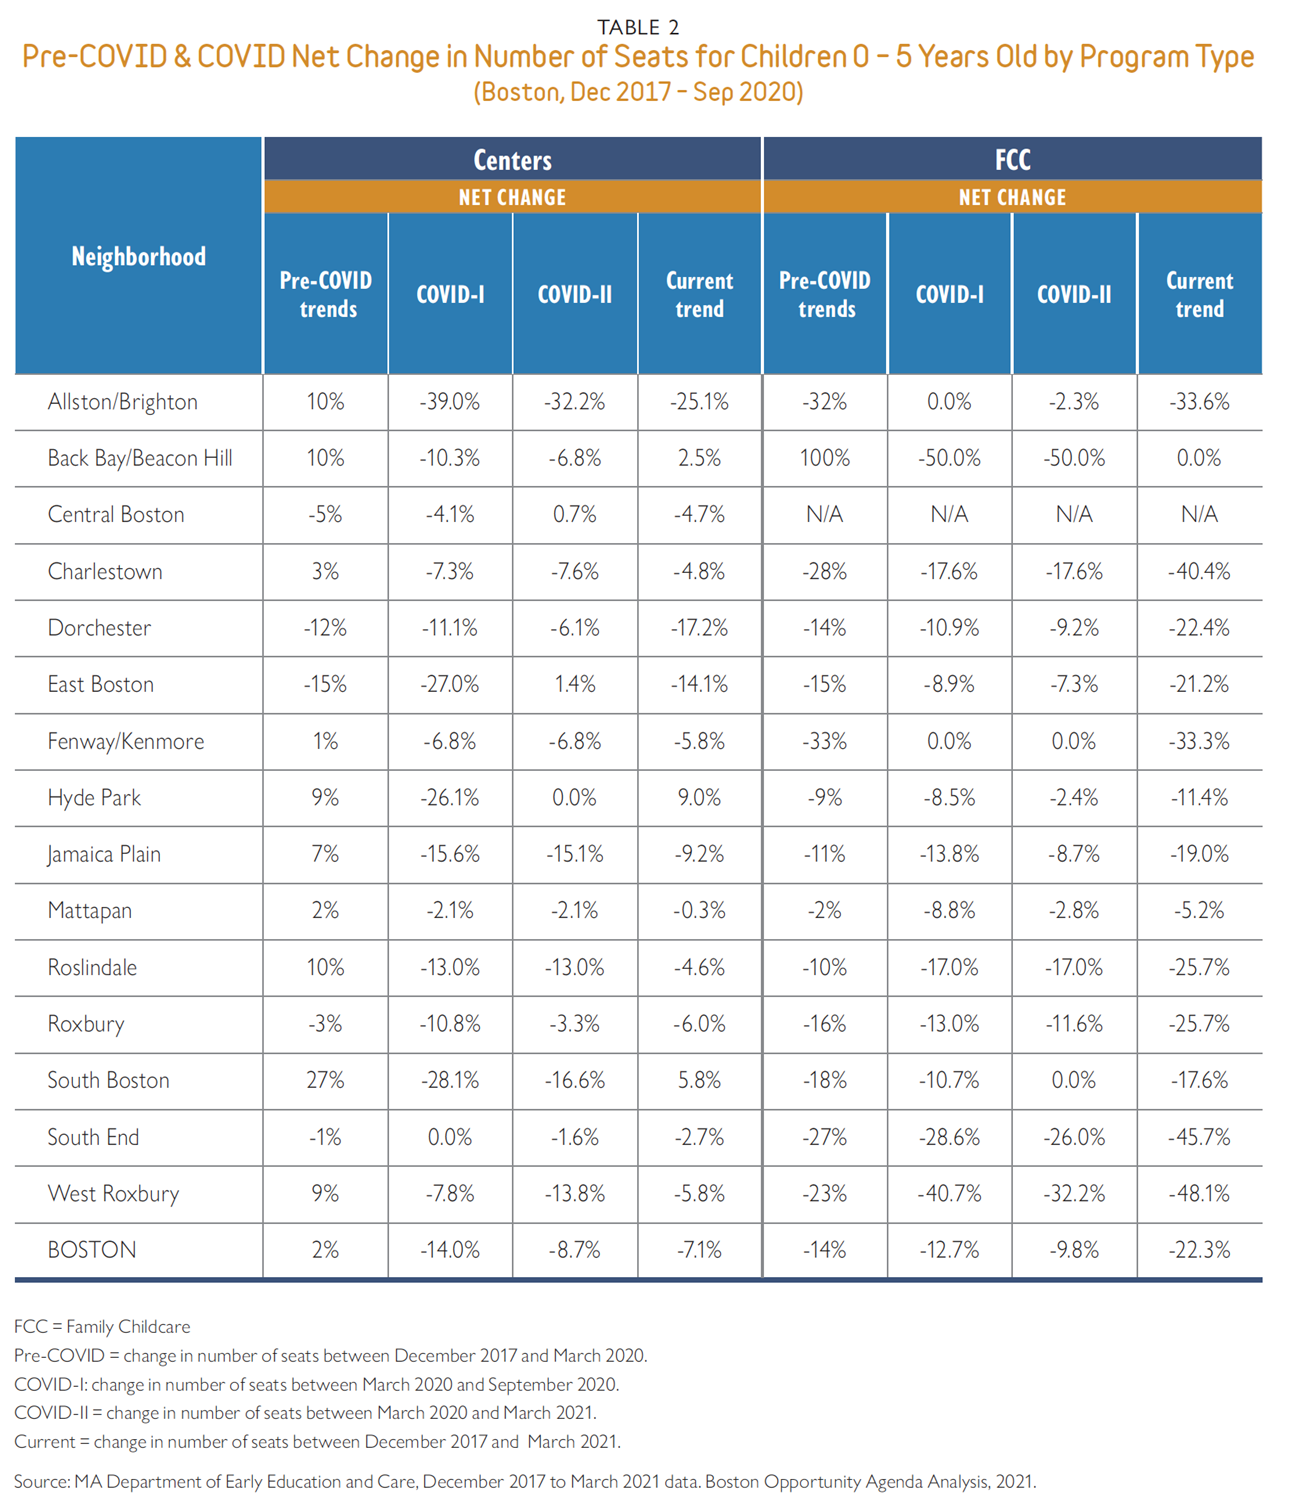
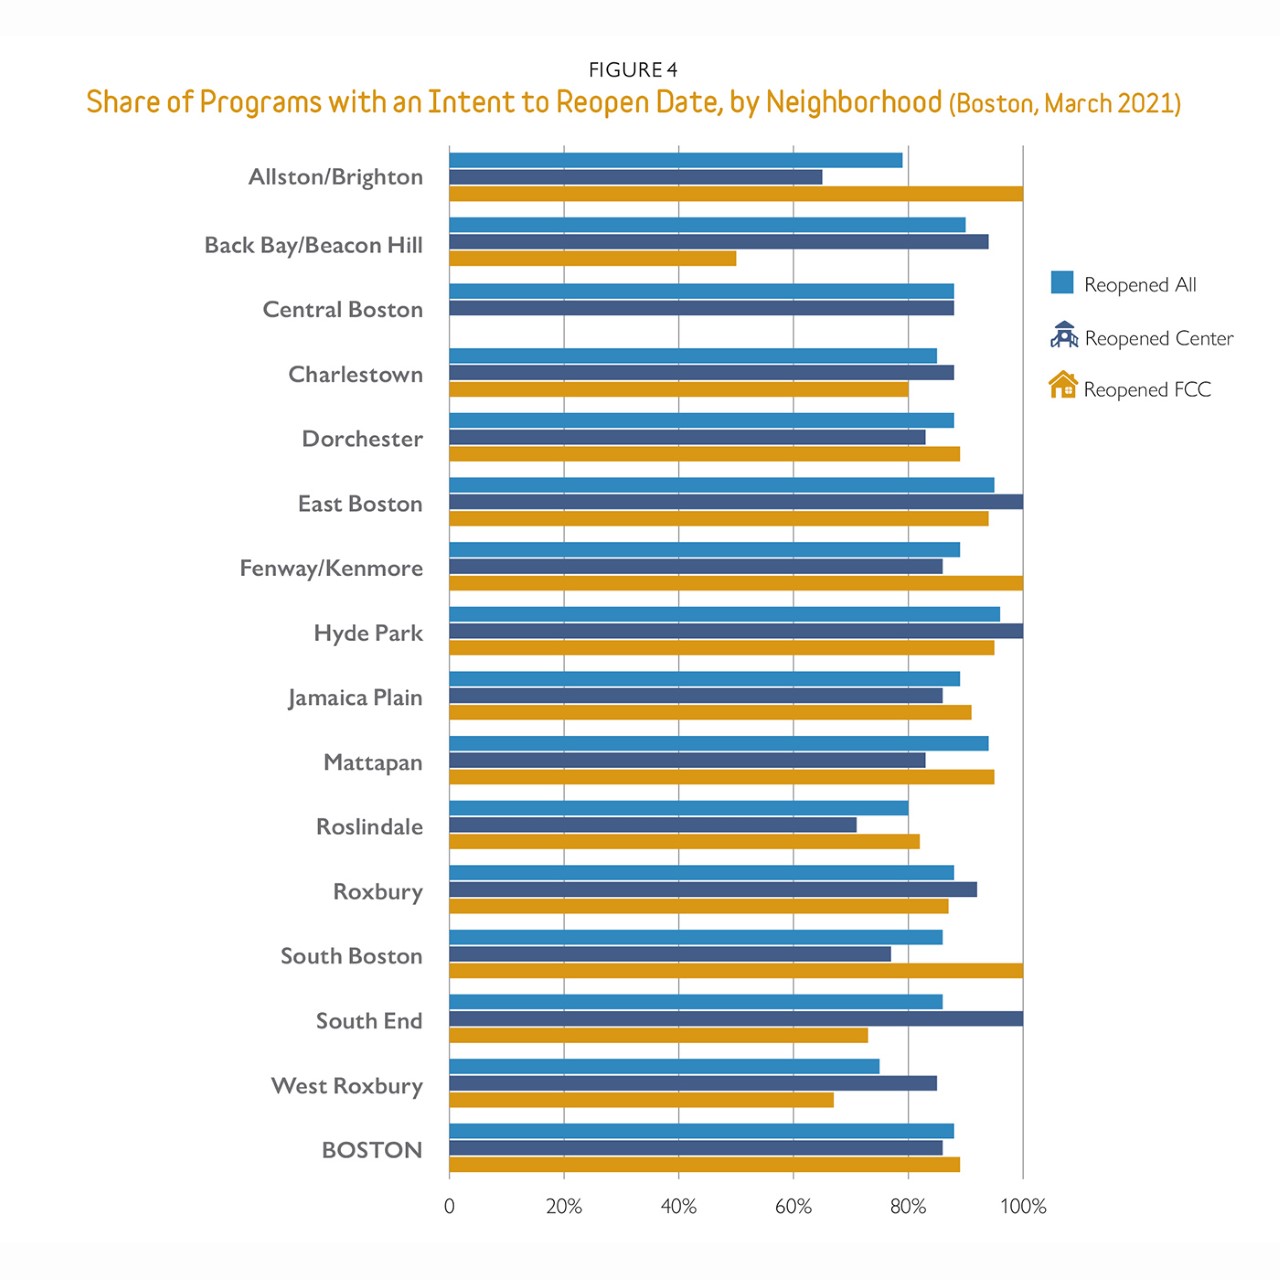
Boston experienced a net loss of 12 percent of its licensed child-care programs from March 2020 to March 2021. However, this city-level trend masks disparities across parts of the sector and neighborhoods. The percentage of programs that reopened between March 2020 and March 2021 ranges from a low of 75 percent in West Roxbury to a high of 96 percent in Hyde Park (see FIGURE 4). Due to the difference in the capacity of centers and FCC programs, these percentages do not give an adequate picture of the number of seats lost across neighborhoods. When looking at seats by neighborhood, center-based programs and FCC recovered at different rates. Three neighborhoods—central Boston, East Boston and Hyde Park—have fully recovered or experienced gains in center-based seats, while Allston/Brighton, Roslindale and South Boston remain below 77 percent. However, for FCC, only East Boston has fully recovered the seats while Back Bay and West Roxbury remain at 50 percent and 67 percent, respectively (see Appendix, TABLE 2). These percentages mean that families in Allston/Brighton and Roslindale who use centers and families in Back Bay and West Roxbury will be challenged to find placements for their children as they return to in-person work and need care.
Age Group by Neighborhood
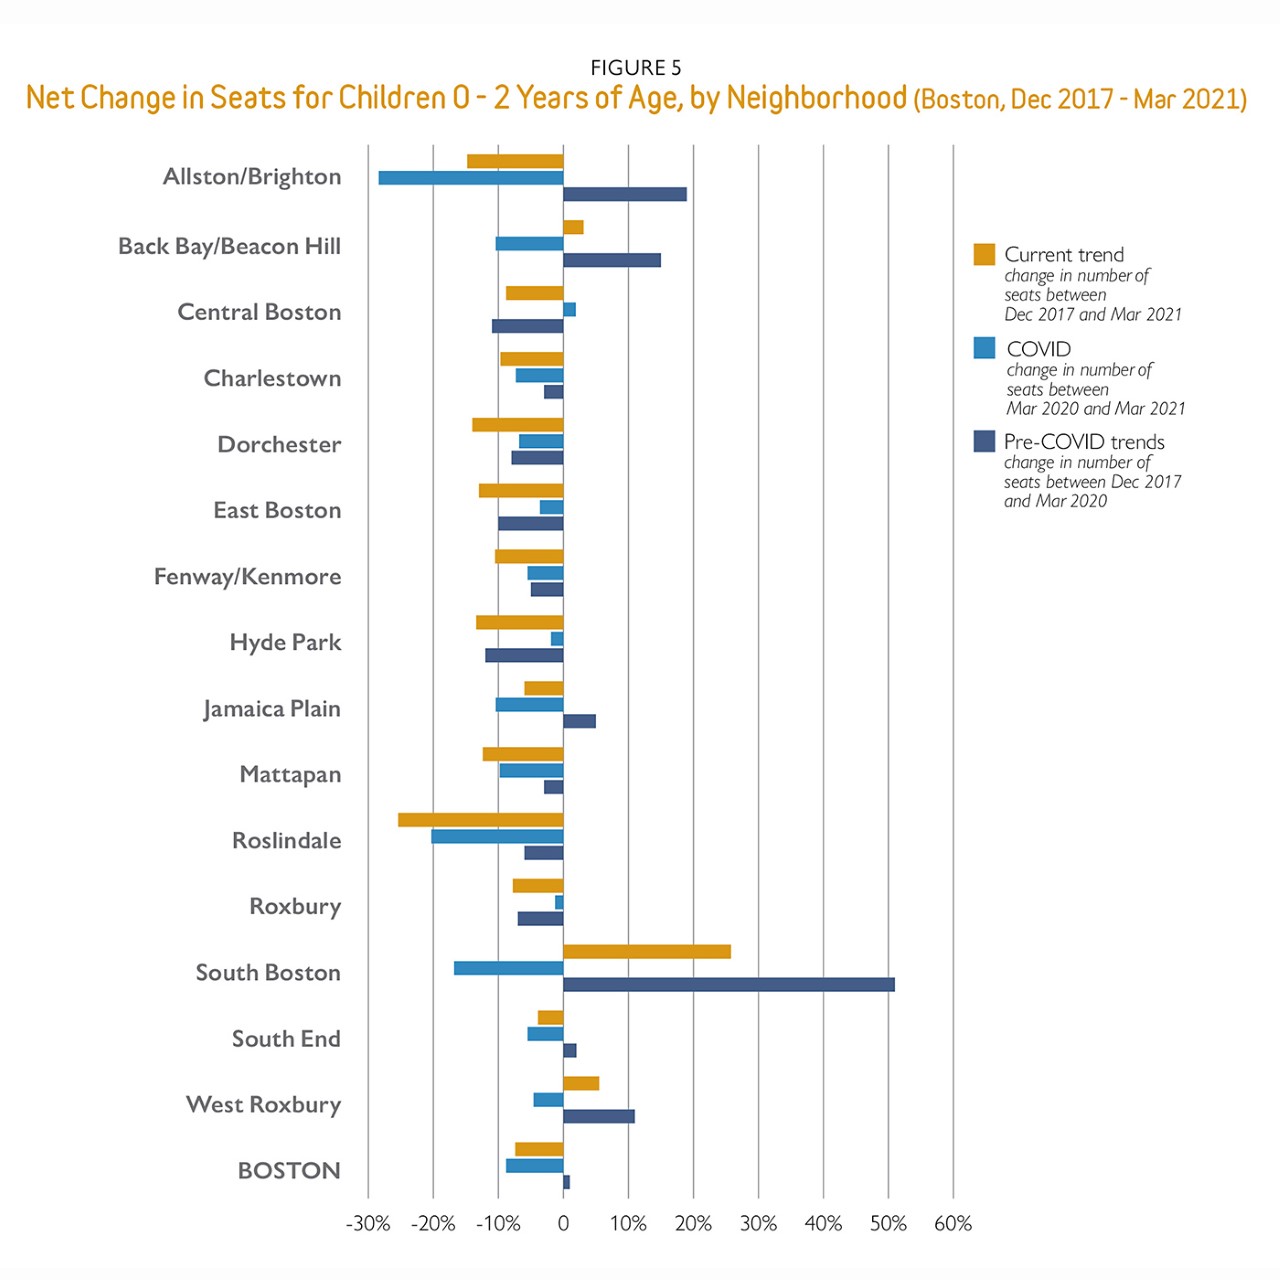
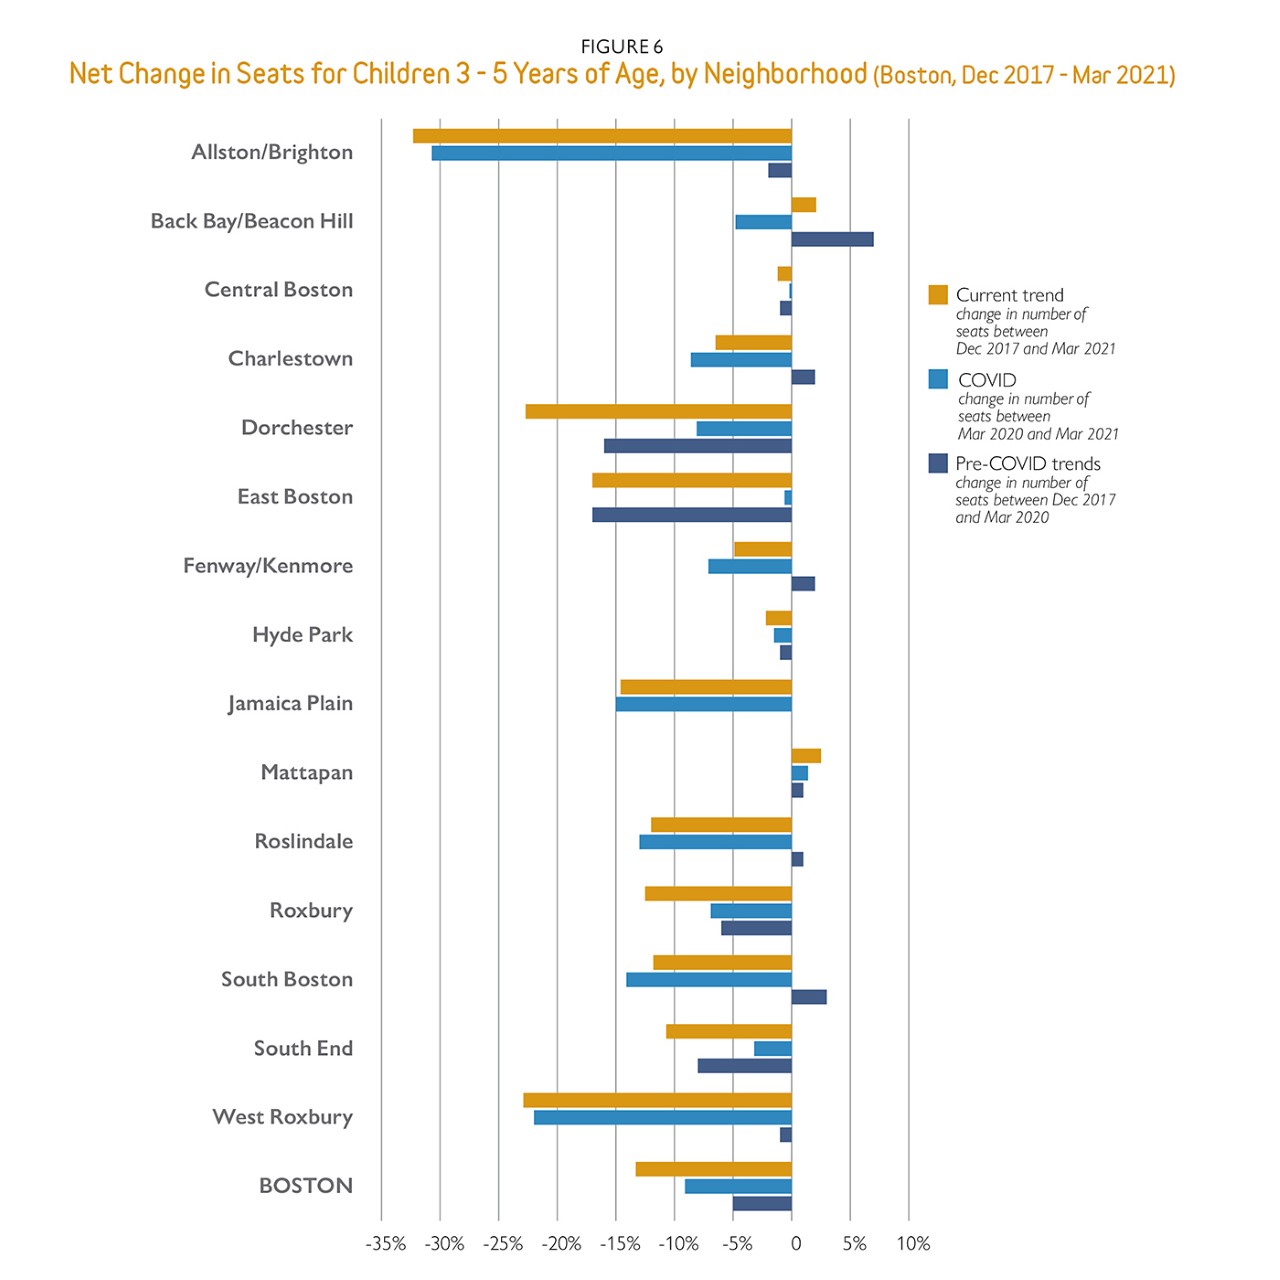
The difference in reopening between center-based and FCC by neighborhood also creates a disparate impact on the availability of care for children by age group (0–2 or 3–5 years). FIGURES 5 and 6 detail the impact on seats by neighborhood for each age group from December 2017 to March 2021 and at various increments within that time frame. For the period March 2020–March 2021, the differences in neighborhood rates for 0–2-year-old children range from losses over 20 percent in Allston/Brighton and Roslindale (28.4% and 20.3%, respectively) to losses of 1.9 and 1.3 percent in Hyde Park and Roxbury, respectively. Only one neighborhood, Central Boston, gained seats during the period. For children 3–5 years, Allston/Brighton and West Roxbury have recovered the least, with losses at 30.7 percent and 22 percent, respectively. Central Boston (0.2%) and East Boston (0.6%) have almost returned to their March 2020 state while Mattapan (1.4%) has experienced a growth in seats. Here again the slow recovery in some neighborhoods means that parents with infants and toddlers in Allston/Brighton and Roslindale will face tremendous challenges finding care.
Overall Trends (December 2017 – March 2021)
The data and analysis above demonstrate the impacts of COVID on the supply of child care from March 2020 to March 2021. The declines compound a continual decline in the number of child-care programs and seats available to children and families in Boston. From December 2017 to March 2021, we have seen a 21 percent decrease in the number of center-based and FCC providers at the city level. During the same period, the number of seats available for children 0–5 years fell by 11.3 percent.
As we move more fully as a city into COVID recovery, there are a few additional points that must be considered. Our initial report used American Community Survey (ACS) data to estimate the number of children in Boston. If we assume that the number of children in Boston has remained the same, our initial gap in child care has grown from 35 percent to 46.3 percent, with variability across neighborhoods.8 When we look at children 0–2 years, the gap has grown from an already extreme access gap of 74 percent to an astounding 81 percent. For children 3–5 years, the change is from a 6.2 percent surplus to a 7.1 percent access gap. This is primarily due to the closure of nine centers and 68 FCCs. Moving from a surplus of seats for children 3–5 to a deficit of seats means that some families will face new, potentially unanticipated challenges finding care.
Finally, a major impact on child growth and development is access to quality care regardless of the setting. COVID has delayed implementation of changes to the state’s Quality Improvement Rating System (QRIS) and many programs have paused their pursuit of accreditation by NAEYC (National Association for the Education of Young Children) while managing through the difficulties of the pandemic. It is therefore challenging to assess the quality of our early childhood programs at scale. As business returns to a new normal, our focus must not only be on providing families and children with access to child care but also on the quality of that care. When young children are in high quality programs, they are more likely to succeed in school, graduate, have a job, own a home, maintain relationships, have better health outcomes and ensure a better start for the next generation. The pandemic has created huge stressors for all children and their families, but particularly for children who live in low-income families. Quality child care can mitigate the stressful effects that they have and continue to experience by fostering resilience through strong relationships and the development of social and learning capacities during the critical early years.9Early Intervention and COVID Impact
Experts and parents have discussed the impact of the pandemic on the growth and development of young children since its very beginning. The American Association of Pediatrics has advocated since as early as January 5, 2021, for schools to reopen (with adequate safety measures) for in-person learning, detailing the important role that schools play in children’s development: educational, social, physical and emotional.10 The same is also true for very young children. Child care and family support settings provide young children with opportunities for interaction and learning but also deliver and connect families to important services like developmental screening and Early Intervention. Throughout the pandemic, due to closures and limited capacity, fewer children have been screened and referred to Early Intervention and other supports. Citywide data from the DRIVE database hosted by the United Way of Massachusetts Bay and Merrimack Valley on the implementation of the Ages & Stages Questionnaire, a developmental screening tool used by family support organizations and center-based child care, show a 15 percent decrease in the total number of screens when comparing March 2019–March 2020 to March 2020–March 2021.
This decrease in developmental screening is of great concern for young children and their families. Developmental screening is important because developmental delays, learning disorders, and behavioral and social-emotional problems are estimated to affect one in every six children, but only 20–30 percent of these children are identified as needing support before they enter school.11 With a validated screening tool, 70–80 percent of children needing support can be identified and connected to services to support their success. The more children are identified earlier, the less stress on the public school system as some children’s developmental delays can be addressed and resolved prior to their entering school. Developmental screening and Early Intervention do not eliminate the need for special education but do mitigate that need by getting children and their families the resources to build developmental skills earlier.
With a significant decrease in developmental screening, young children and their families may have missed as much as a year and a half of support. In the life of a two- or three-year-old, this is an enormous amount of time, particularly because nearly 90 percent of brain development occurs between the ages of 0 and 5 years. For parents and caregivers of these young children, missing developmental screening results in decreased connection to resources and referrals like Early Intervention that not only support their child’s growth and development, but can significantly bolster skills and confidence in parents as their child’s first teacher. Through Early Intervention services, parents build a toolbox of strategies to use to support their child’s development that are integral in the moment, and significant in empowering parents in their children’s education.
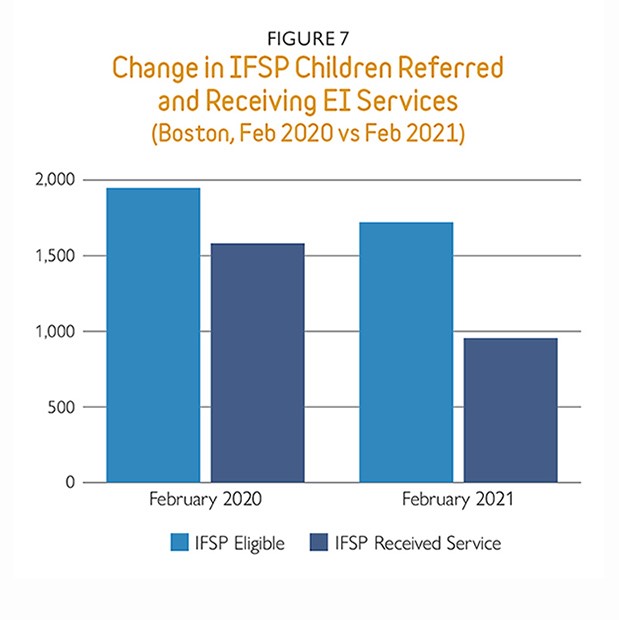
Even in a typical year, not all children referred for EI actually receive services. In February 2020, 81 percent of eligible children referred to EI accessed services. But in February 2021, only 55 percent of those referred to services received them. In other words, although Boston saw a decrease (-12%) in the number of eligible children referred to Early Intervention services, the largest drops (-40%) were seen in the number of children receiving services (see FIGURE 7). Contributing factors to this precipitous drop could be disparities in access to technology and the challenges of providing virtual interventions. In February 2020, 100 percent of services were provided in-person. One year later, in February 2021, 99 percent of services were delivered through telehealth.
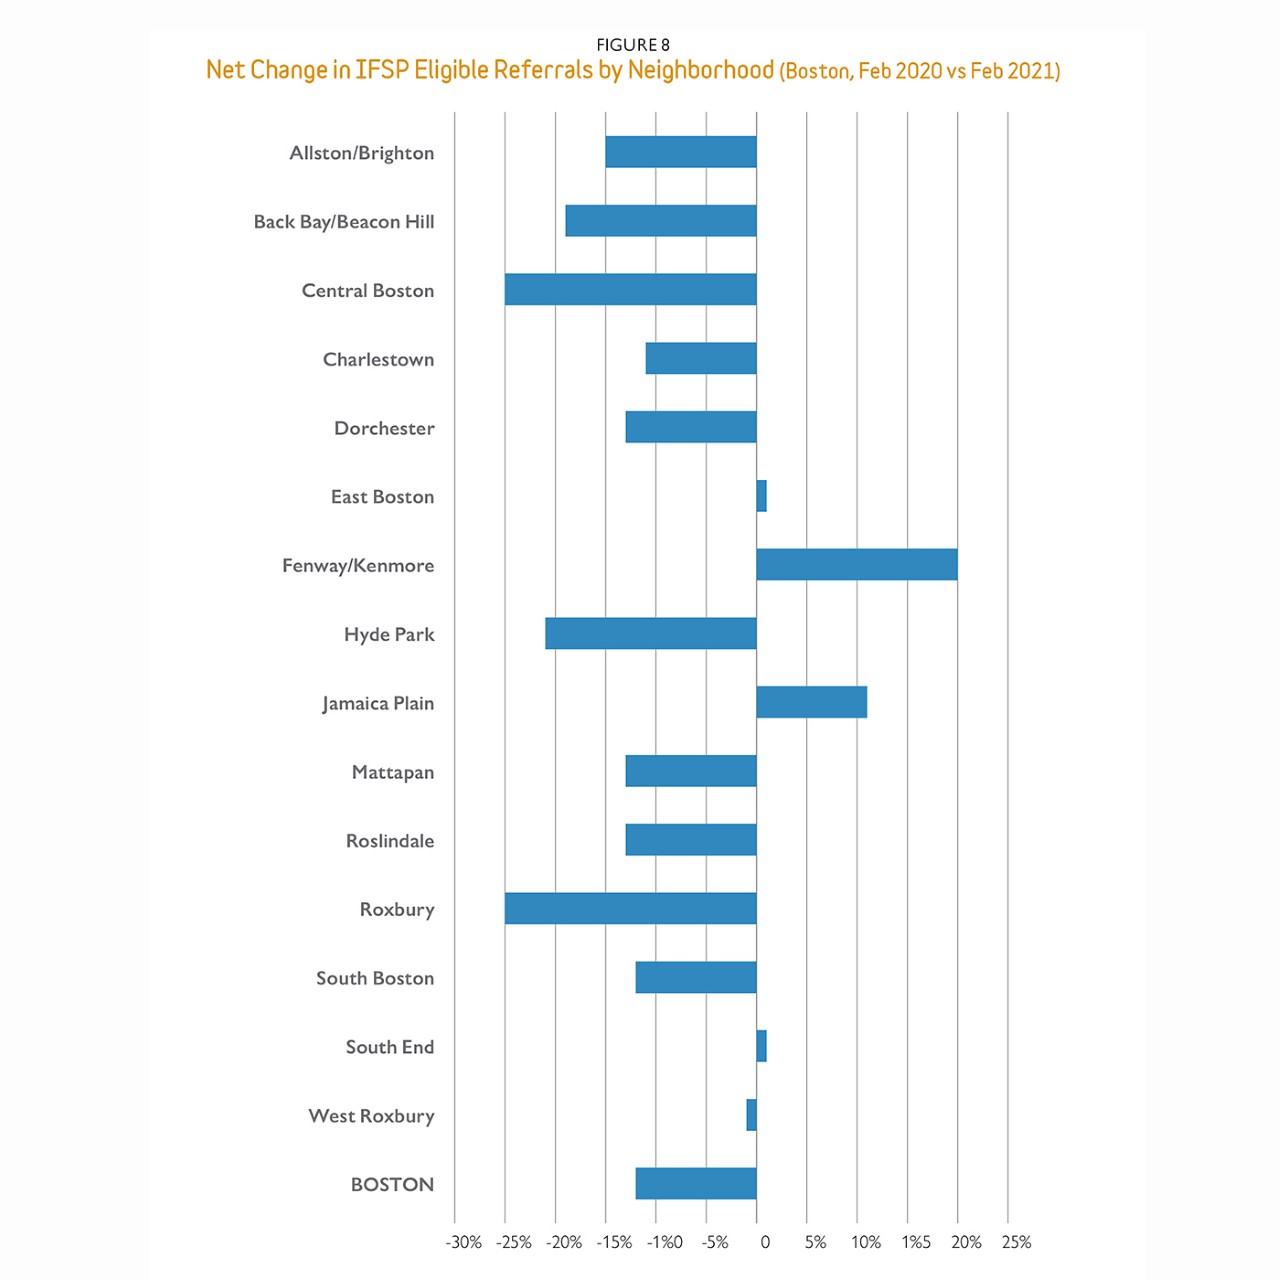
The citywide drop in children referred to and receiving services is not distributed equally across neighborhoods. As seen in FIGURE 8, most neighborhood saw declines in the number of eligible children referred to Early Intervention with central Boston, Roxbury and Hyde Park seeing the steepest drops (-25%, -25% and -21%, respectively). The Fenway/Kenmore was the only neighborhood that saw an increase in the number of children referred (+20%), while East Boston, South Boston and West Roxbury remained relatively flat.
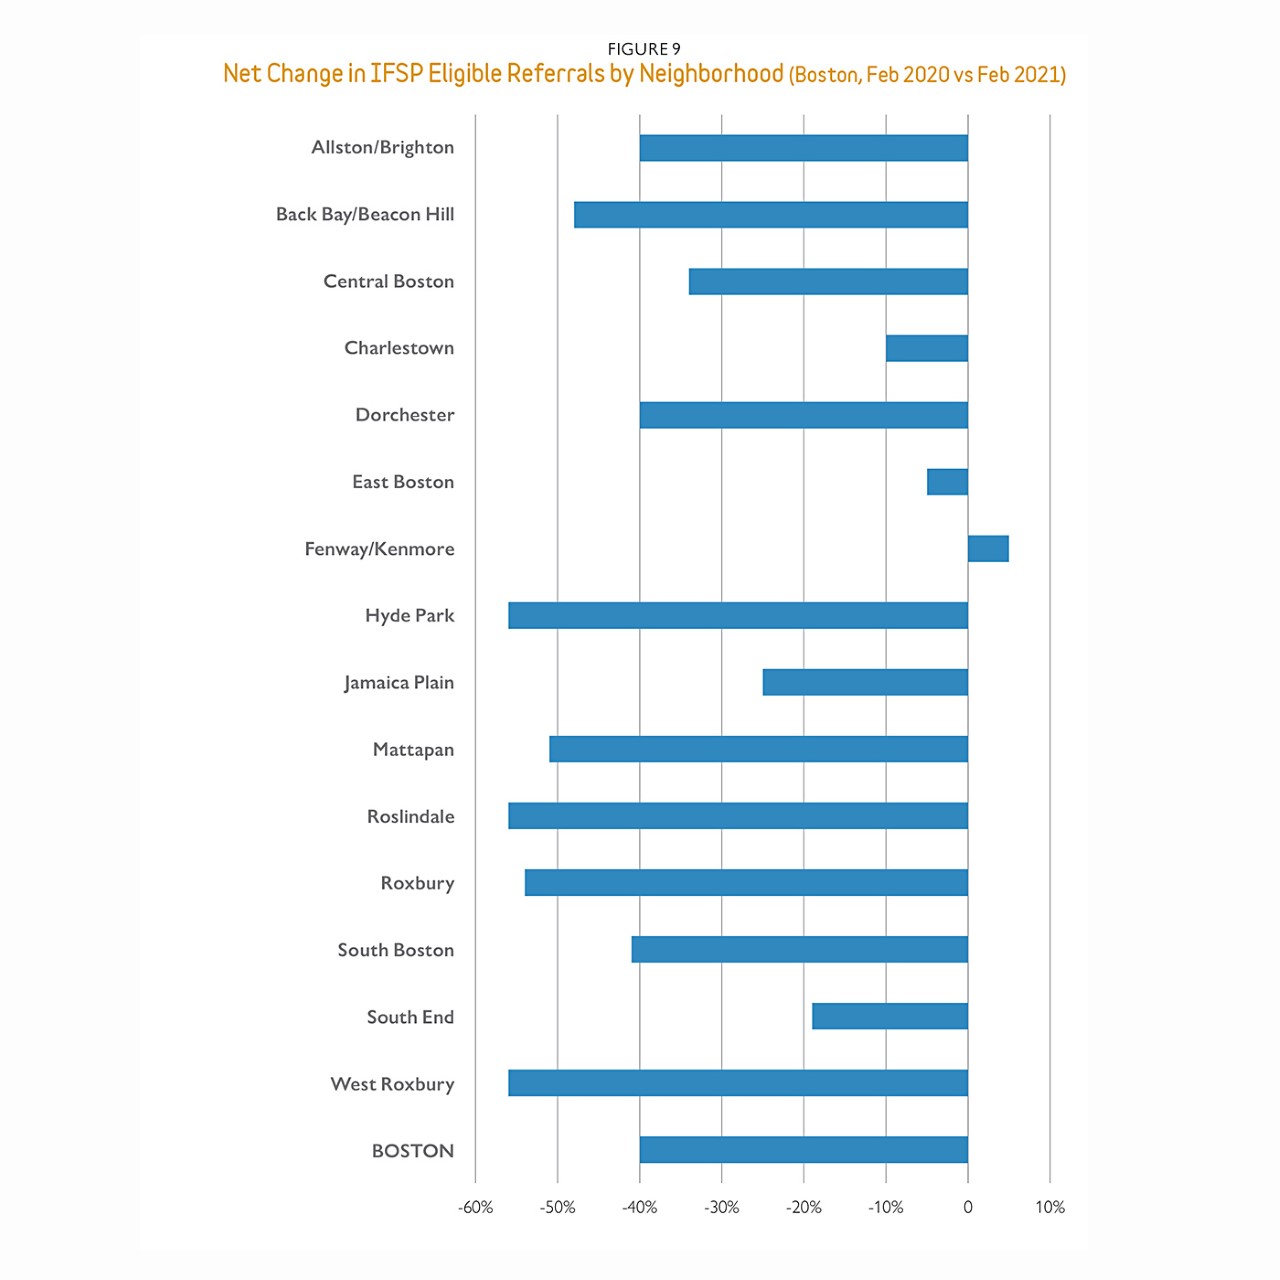
Similar declines were seen across neighborhoods when examining the number of children receiving services, as FIGURE 9 shows. The decline in number of children receiving services was often greater than the decline in the number of children referred, proving that a smaller referral pool is not the sole reason behind these negative trends. Hyde Park, Roslindale and West Roxbury all experienced a 56 percent drop in children receiving services. Although the Fenway/Kenmore neighborhood saw a 20 percent increase in referrals, the number of children receiving services increased only 5 percent.
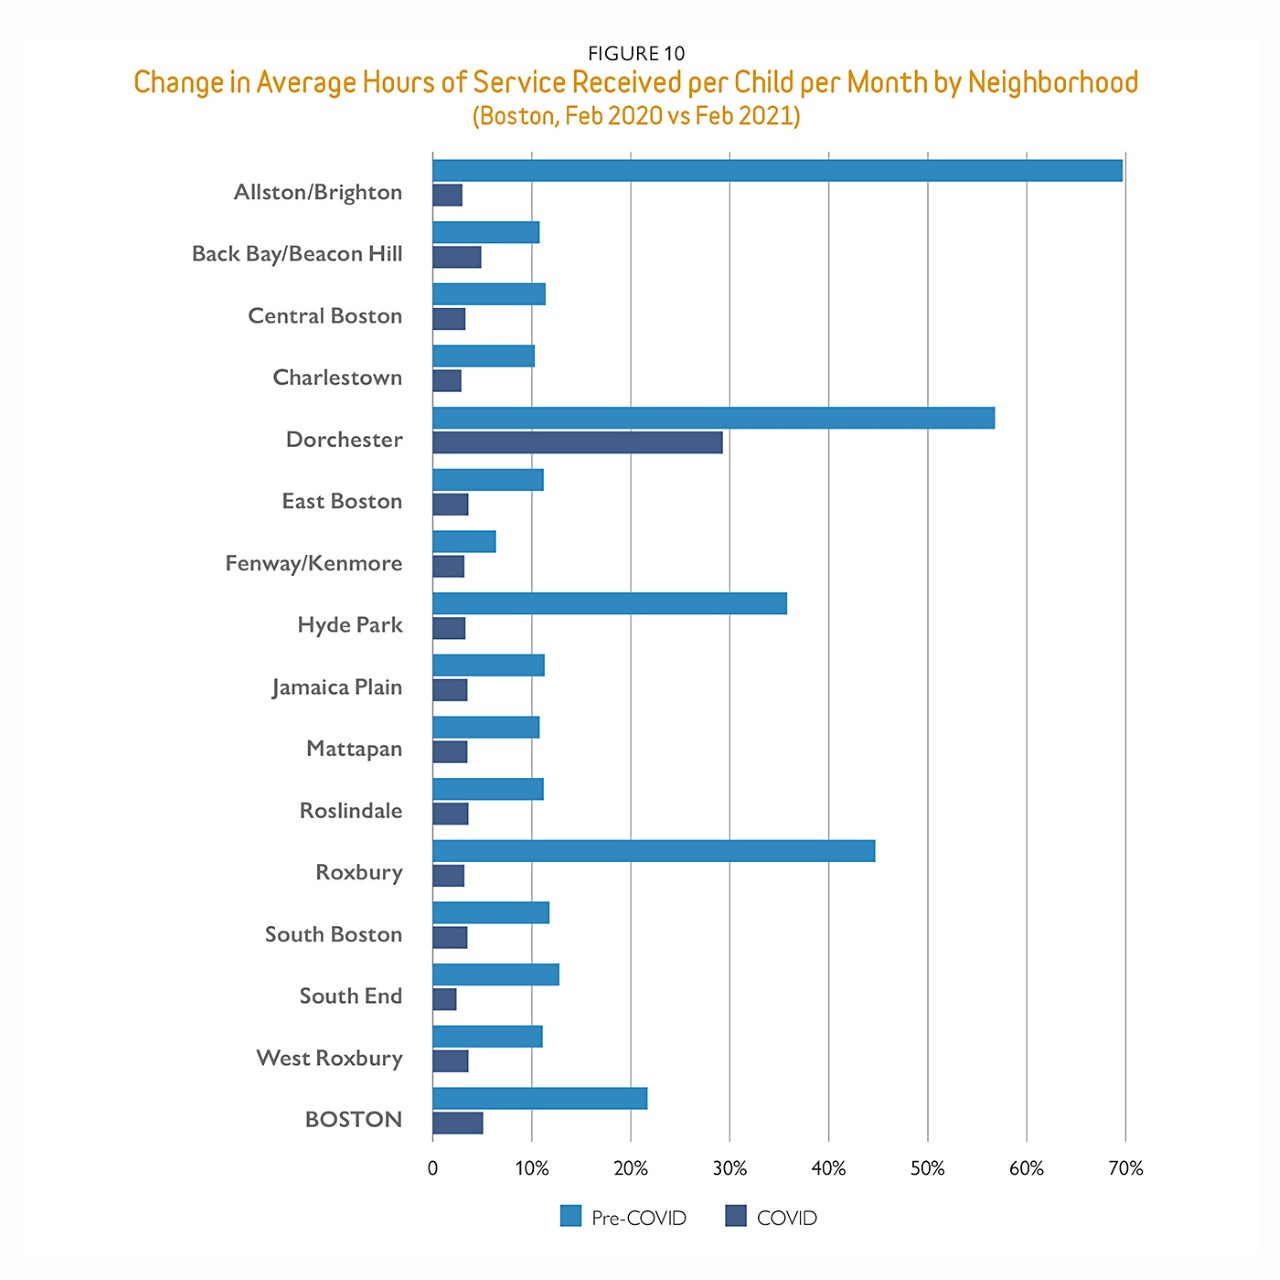
Perhaps even more striking, the average hours of service received per child also saw steep declines. In February 2020, each child received roughly 22 hours of service on average per month. In February 2021, the average was just five primarily telehealth hours. Not only are fewer children receiving services, but the children who do receive services get less of it (see FIGURE 10).
As Early Intervention providers return to providing in-person services, we anticipate that these numbers will return to regular service levels. However, the gap in services for the young children that would have been served is critical time that has been lost. Schools and other settings will need to anticipate an increase in young people who otherwise would have had the necessary interventions prior to their arrival but due to COVID did not. Additionally, as a city we (providers, pediatricians, family support organizations and others) need to ensure that all young children receive developmental screening and referrals as needed regardless of their early education and care setting. The Boston Opportunity Agenda and its partners are working to develop the city-wide infrastructure to achieve universal developmental screening for young children and to use the data to improve service delivery.
Policy recommendations
Child-care infrastructure has proven itself to be critical to the sectors of education, public health and the city’s economy. Yet not all families can access this critical infrastructure. The Baker-Polito Administration’s “Future of Work” report released this month surveyed Massachusetts families and found that 13 percent of respondents with children said they might resume working or enter the workforce if they had access to additional childcare.12 Whether in Massachusetts or Boston, our economy cannot afford to leave 13 percent of working families on the sidelines of the economy, solely due to lack of child care.As parents in Boston return to the workplace in person, it is critical that city, state and federal governments along with philanthropy and business focus time, attention and resources on increasing the number of high quality child-care seats available to families in the city of Boston. The data analysis and findings from this second COVID brief are such that our policy recommendations from September 2020 remain the same. Click on the headers below to see those recommendations, first published in November 2020.
FCC providers in Boston lack basic business skills. For example, while FCC providers have experience caring for children, many could not initially apply for PPP during the COVID shutdown because they did not have a business bank account. University of Massachusetts Boston, Massachusetts Shared Services, Children’s Hospital Boston Child-Care Support Initiative and the City of Boston’s Child-Care Entrepreneur Fund have stepped up to offer training as well as financial support and coaching. These initiatives need to continue and be expanded to serve the FCC and center-based providers that need them. Providers need learning opportunities that are linguistically accessible, flexible and offered throughout the year to increase their business stability and quality.
Child-care stakeholders need real-time data to make informed policy decisions. A strong data infrastructure, which is robust in K–12 settings, is lacking in the early childhood ecosystem. In early child-care, basic questions are difficult to answer on several fronts: enrollment and attendance, child-care deserts, workforce needs, etc. We need better data to know where public and private investment is necessary and to continue to monitor the successful implementation of child-care. EEC has taken several positive steps toward better data collection and reporting in 2020, including regularly surveying providers, tracking closures and reopenings, and calculating system utilization by region. EEC should continue to advance its data systems and work to connect them to the K–12 infrastructure so that the entire education pipeline is visible and transparent for policy and funding decisions.
As demonstrated in the data, accepting subsidies was the strongest predictor of a Boston child-care program declaring its intention to reopen in September 2020. Expanding state investment not only meets the needs of providers, it also ensures affordable care for families. Only 7 percent of children under the age of 6 meet the federal income requirement to receive subsidies in Massachusetts. The Centers for American Progress, therefore, identified that our state needs to expand its investment to adequately cover the extreme high cost of child-care here for all low- and middle- income families. The positive impact is estimated to be substantial not only for children and families, but also for the state economy. Increased federal and state investment also preempts a secondary crisis that the collapse of the child-care industry would generate.
a. Rethink investment in the provision of child-care for middle- and low-income families. EEC was able to provide two critical supports to child-care providers during the closure period. Subsidy payments to providers continued during the pandemic despite the child-care shutdown. In this instance, EEC was able to secure the future provision of care through what was essentially stabilization funding. It was an incredibly successful intervention. Compared to programs with fewer than four children on subsidies, programs with four to 10 such children were three times more likely to reopen and programs with more than 10 children on subsidies were four times more likely to reopen. Additionally, Emergency Child-Care providers received payments for ensuring that emergency drop-in care was available to essential workers. Payments were made based on providing the opportunity for care and not on actual uptake. Massachusetts should build on these findings to rethink the way that the Commonwealth invests in the provision of child-care for middle- and low-income families.
b. Businesses must take a more active role in understanding and supporting employees’ child-care needs and building the public/private partnerships necessary to meet them. Data from multiple Massachusetts surveys show that work and child- care are intertwined. Businesses can do more to support their employees—it is an imperative for attracting and retaining talent. We recommend Boston-based businesses examine the data in this report as well as the recommendations in our first annual State of Early Education and Care Report published last year and review their HR policies to devise new ways they can support child-care. As noted in a recent speech to the Boston Chamber, “A lack of access to child-care is ‘holding our economy hostage...’. Child-care should be thought of as a public good like transportation infrastructure rather than as a personal choice for parents.”
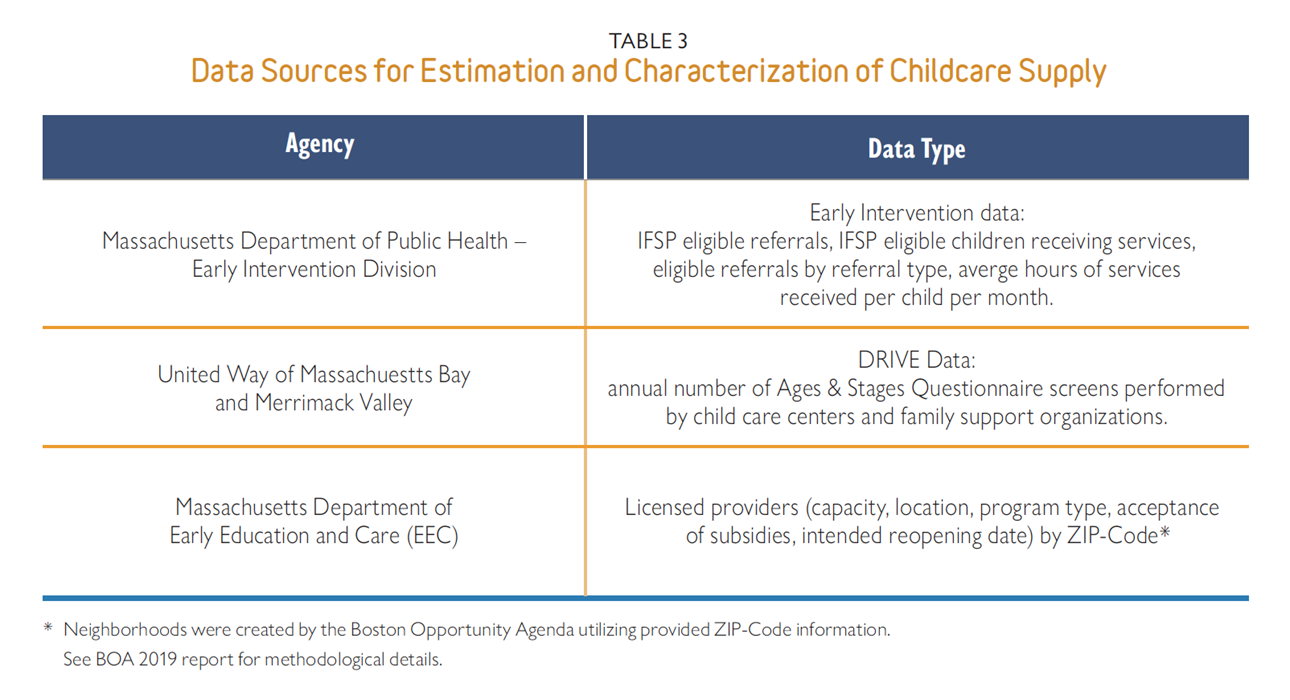
Data used for this brief came from the Massachusetts Department of Early Education and Care (EEC), Massachusetts Department of Public Health – Early Intervention Division (DPH-EI), and United Way of Massachusetts Bay and Merrimack Valley. Table 1 (see Appendix, TABLE 3) offers more information for the data utilized from each one of the sources. Analyses were conducted in Stata 17 and Excel; significant differences are noted in the text.
Using EEC data, we describe “current COVID trends” (December 2017–March 2021) on the supply of child-care programs and seats (spots available for children in a child-care program) for children 0–5 years old in Boston neighborhoods. Our reopening analysis explored program type, neighborhood characteristics, and payments that could help us understand which of the programs that were open in March 2020 were more likely to reopen by March 2021.
From our 2019 report The State of Early Education and Care in Boston: Supply, Demand, Affordability and Quality, which used 2017 data, we replicated the methodology for distribution of seats by age group and definition of Boston neighborhoods. As done in the first brief, we did not include information on the number of seats in public and non-public schools given the current focus on the child-care industry. See the Methodology section in our 2020 brief for more details.
We updated descriptive statistics for the number of programs and seats in the city between December 2017 and March 2021, by program type (center-based and family child care), age groups (0–2 and 3–5 years of age) and 15 ZIP Code–defined neighborhoods. We used a logistic regression to understand whether certain characteristics of programs open at the beginning of March 2020 predicted their reopening by the end of March 2021.
Using MA DPH-EI data, we describe “COVID trends” within Boston’s early intervention system by comparing February 2020 data with February 2021 data. We chose to examine these exact months for two reasons: 1. Due to a reporting lag, February 2021 was the most recent data we could obtain considering the timeline for this publication. 2. Early Intervention data in normal circumstances does not drastically change from month to month, making us confident that February 2020 could serve as an accurate pre-COVID baseline. Our analysis focused heavily on changes in early intervention referrals and services received for children considered eligible for early intervention.
Endnotes
1. Campbell, F.Q. and Patil, P. A. (2019). State of Early Education and Care in Boston: Supply, Demand, Affordability, and Quality. Boston Opportunity Agenda. Available at: https://www.tbf.org/-/media/tbf/reports-and-covers/2019/early-ed-census-201911.pdf?la=en
2. Campbell, F.Q., Patil, P. A, McSwain, K. (2020). Boston’s Childcare Supply Crisis: What a Pandemic Reveals. Available at: https://www.bostonopportunityagenda.org/-/media/boa/early-ed-census-2020-pt-1-202011.pdf. Accessed on 7/1/2021.
3. Commonwealth of Massachusetts. (2020). Massachusetts Emergency COVID-19 Child Care. Available at: https://eeclead.force.com/apex/EEC_ChildCareEmergencyProcedure. Accessed on 7/26/2020.
4. MA Department of Early Education and Care. (2020). “Massachusetts Child and Youth Serving Programs Reopen Approach: Minimum Requirements for Health and Safety” Available at: https://eeclead.force.com/resource/1591036172000/Min_Req. Accessed on 7/1/2021.
5. MA Department of Early Education and Care. (2020). Data analyzed by the Boston Opportunity Agenda.
6. Campbell, F.Q., Patil, P. A, McSwain, K. (2020). Boston’s Childcare Supply Crisis: What a Pandemic Reveals. Available at: https://www.bostonopportunityagenda.org/-/media/boa/early-ed-census-2020-pt-1-202011.pdf. Accessed on 7/1/2021.
7. Notice that the 2020 Brief showed 682 programs operating in March 2020. Revised data shared by EEC in 2021 shows that one more program was operating at that time and we adjusted the current analysis to reflect the revision. This additional program and its 24 seats for children 0–3 years of age did not alter the direction of findings and the related conclusions published last year.
8. We are making these projections assuming the number of seats in public and non-public schools remained the same, as we’ve utilized all seats available at Boston for children 0–5 years of age when computing demand–access gaps in our 2019 publication.
9. National Scientific Council on the Developing Child. Excessive Stress Disrupts the Architecture of the Developing Brain: Working Paper 3 (Updated Edition). [Online] 2005/2014. [Cited: July 20, 2019.] http://www.developingchild.harvard.edu.
10. Jenco, M. (January 5, 2021). AAP continues to advocate measures to allow students to return safely to school. Available at https://www.aappublications.org/news/2021/01/05/covid-school-safety-010521. Accessed on July 12, 2021.
11. Component Seven: Surveillance and Screening Facilitator Manual, Medical Home Initiatives for Children with Special Needs. Retrieved January 2, 2006, http://www.medicalhomeinfo.org/training/materials/April2004Curriculum/SS/Screening Facilitator.pdf.
12. Baker-Polito Administration. (July 13, 2021). Preparing for the Future of Work in the Commonwealth of Massachusetts. Retrieved from: https://www.mass.gov/doc/future-of-work-in-massachusetts-report/download.

